Real-time monitoring of a SOA/ADF
11g server Sun JVM can be provided by several tools. Many of you must have used
or heard about Java VisualVM tool. VisualVM is a tool that provides
a visual interface for viewing detailed information about Java applications
while they are running on a Sun Java Virtual Machine (for JRockit we would use
JRockit Mission Control). VisualVM has features of use to application
developers, system administrators, quality engineers and application users.
Below are some of its key functions and features.
§ Display local and remote Java applications.
§ Display application configuration and runtime
environment.(You can see the JVM startup parameters and properties)
§ Monitor application memory consumption and
runtime behavior(Heap/Non Heap usage and GC Info)
§ Monitor application threads.(Displays number of threads
in JVM, their status ie Running, Sleeping, Inactive, Deadlock)
§ Profile application performance or analyze
memory allocation (Used to troubleshoot Memory Leak and OOM Issues)
§ Take and display thread dumps (Can be used to
troubleshoot performance issues)
§ Take and browse heap dumps.(Used for
troubleshooting Memory Leaks)
§ Analyze core dumps and applications offline.
This tool is available in the HotSpot JDK
installation $HotSpot_JDK_INSTALL/bin. It is started by running the jvisualvm
executable. JVisualVM can be run either on the same machine on which the SOA/ADF
server runs or on a separate machine from the SOA runtime server.
Monitoring Local JVMs using
JVisualVM:
If you are running JVisualVM on the same machine,
on which SOA/ADF JVM runs, the setup is quite simple and straight forward. You
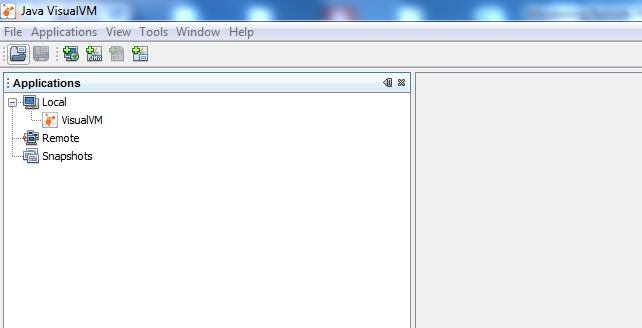
simply have to go to the $JAVA_HOME/bin and run the jvisualvm executable. As
shown below under the Local icon you can find the local JVM process PIDs and
the needed information. Double click on any one of the processes under Local icon and on the right hand
side of the screen you would be able to see the desired information (described
later)

Monitoring Remote JVMs using JVisualVM:
If
running JVisualVM from a remote machine, i.e. a JDK that is remote to the SOA
Managed Server you will need to configure a JMX port in the JVM startup
parameters in order to monitor the SOA/ADF server JVM. Below are the
steps:
1. Configure a JMX port.
1. Configure a JMX port.
Add
the below -Dcom.sun.management.jmxremote
parameters to the SOA/ADF Managed Server JVM startup parameters.Keep in
mind that you only want to define this for a specific server in the domain
since reuse of the JMX port number between servers will not be allowed. For
example if you want to monitor the JVM on soa_server1 you could add the
following to its JVM startup parameters:
-Dcom.sun.management.jmxremote
-Dcom.sun.management.jmxremote.port=8500
-Dcom.sun.management.jmxremote.authenticate=false
-Dcom.sun.management.jmxremote.ssl=false -Djavax.management.builder.initial=weblogic.management.jmx.mbeanserver.WLSMBeanServerBuilder
So after adding the above parameters the JVM
startup parameters would look like:
-server -d64 -Xss256k -Xms1g
-Xmx1g-XX:NewRatio=2 -XX:+AggressiveOpts -XX:PermSize=512m -XX:MaxPermSize=512m
-XX:+UseParallelGC -XX:+UseParallelOldGC -XX:ParallelGCThreads=16
-XX:InitialSurvivorRatio=10 -XX:SurvivorRatio=10 -Dweblogic.management.discover=false
-Dweblogic.StuckThreadMaxTime=900 -XX:+HeapDumpOnOutOfMemoryError
-XX:HeapDumpPath=/tmp/soa_server1_gc.hprof -verbose:gc
-Xloggc:/tmp/soa_server1_gc.log -Dcom.sun.management.jmxremote
-Dcom.sun.management.jmxremote.port=8500 -Dcom.sun.management.jmxremote.authenticate=false
-Dcom.sun.management.jmxremote.ssl=false
-Djavax.management.builder.initial=weblogic.management.jmx.mbeanserver.WLSMBeanServerBuilder
- On How to tune JVM for SOA 11g refer to my post JVM Tuning for SOA 11g
- On how to change JVM startup parameters for SOA 11g refer to my post Change SOA 11g Startup parameters
2. Restart the SOA/ADF Managed Server (The
JVM parameters of which were modified in Step 1)
3. Download and install JVisualVM from here on your local
machine.
4. Open the Command Prompt on your Local Machine and
navigate to the JAVA_HOME/bin as shown below. Enter the command as shown. You can also pass JVM parameters after a -J, for example to set
the maximum PermSize to 256MB:

The JVisualVM Console:
5. Install All of the Available Plug-ins Select
Tools -> Plugins download and install all of the available plugins, this
will give additional display tabs once connected to a JVM. Restart JVisualVM,
going back into Tools -> Plugins -> Installed Tab should show all of the
installed plug-in:

6. Create a Remote Connection if Running
JVisualVM Remotely from the SOA Server
Select
the Add Remote Host icon:

7. Enter the Hostname of the server on which the SOA/ADF
managed server is running. Display name can be anything related to the physical
server. I chose it to be TEST_ADF_Server)

8. Right click on Test_ADF_Server under
Remote icon and click on Add JMX Connection.

9. After the : in the Connection field enter the
defined JMX port of 8500, this is from Dcom.sun.management.jmxremote.port=8500
also check the Display name box(Can be the JVM name):Click OK

10. After few seconds you
should find the Display name(You specified in the previous step under the
TEST_ADF_Server icon.

11. Right Click and click on Open. On the
right hand side page you should find the JVM details as shown below.

Hurray !! You are now connected to the remote JVM via your
local JVisualVM.
You can explore all of the tabs provided,
these seem to be the most useful:Some of them are mentioned below:
1. The Monitor tab:
Provides the following
graphs of the running system:

Also there is a Perform GC button to force a
garbage collection and a Heap Dump button to cause a heap dump. The resulting
heap dump will be eventually loaded into JVisualVM in a new tab where it can be
analyzed. The loading may be slow and perhaps not as detailed as one would
like. It may be a better idea to take heap dumps from the command line from the
JDK installation where the SOA server is running:
The Threads tab:

The VisualGC Tab:
It might report you the below issue(Not Supported for the JVM)

This issue occurs when
there is a version mismatch between You will get
this if the JDK running JVisualVM and the SOA server are not the same version
or if the operating systems do not matchMake sure you use the same version of
JDKs.
This tab provides a visual representation of
the memory Spaces being used in real-time in the PermGen, Old Gen, Eden Space,
and Survivor Spaces (S0 & S1). This gives an idea of how how full each
partition is at any given time. You can use this to scale the defined memory for
the spaces based on actual load.The Graphs section
also provides information on the maximum and current sizes of the spaces and
their garbage collection statistics.
Conclusion
So in the post I basically have shown how would you use JVisualVM to connect to remote as well as local SOA ADF JVMs. Hope this post was helpful. I havent covered the basics and functions of jvisual vm in detail as there are too many posts already. You can find Oracle documentation here
When it comes to SOA Heap dumps, the heap dumps generated might grow very large.The Heap Dump analysing part in jvisualvm might not work well on large jvms(greater than 3 GB). For such JVM heap analysis I would suggest you take manual dumps using jmat and analyse the dump using eclipse memory analyser. I am currently trying this in my lab and will post my updates soon.
When it comes to SOA Heap dumps, the heap dumps generated might grow very large.The Heap Dump analysing part in jvisualvm might not work well on large jvms(greater than 3 GB). For such JVM heap analysis I would suggest you take manual dumps using jmat and analyse the dump using eclipse memory analyser. I am currently trying this in my lab and will post my updates soon.
References
- jvisualvm - Java Virtual Machine Monitoring, Troubleshooting, and Profiling Tool http://docs.oracle.com/javase/6/docs/technotes/tools/share/jvisualvm.html
- VisualVM - http://en.wikipedia.org/wiki/VisualVM
- VisualVM Home page - http://visualvm.java.net/
How did you like this post. Let me know if it helped.
Now you can folow us on facebook and post your comments/views and questions for expert advise. Check this out facebook
Find us on facebook here
Did you know that you can earn cash by locking premium pages of your blog / site?
ReplyDeleteAll you need to do is open an account on AdscendMedia and run their content locking plugin.
https://bayanlarsitesi.com/
ReplyDeleteCihangir
Heybeliada
Yalova
Adana
ON0WU
Antalya
ReplyDeleteTrabzon
Niğde
Maraş
Antep
82842
Antalya
ReplyDeleteAntep
Burdur
Sakarya
istanbul
MEZ
Batman
ReplyDeleteArdahan
Adıyaman
Antalya
Giresun
ZZF72
ankara parça eşya taşıma
ReplyDeletetakipçi satın al
antalya rent a car
antalya rent a car
ankara parça eşya taşıma
A7DU62
0DF46
ReplyDeleteKripto Para Kazanma Siteleri
Binance Yaş Sınırı
Twitch İzlenme Hilesi
Bitcoin Nasıl Alınır
Youtube İzlenme Hilesi
Parasız Görüntülü Sohbet
Threads İzlenme Hilesi
Bitcoin Kazma
Keep Coin Hangi Borsada
7B6FB01B47
ReplyDeleteemoji coin
mitosis
aethir
dymension
medi finance
bitget
dymension stake
tokenfi
rocketpool stake
64270D5756
ReplyDeletetelafili takipçi satın al
Kaspersky Etkinleştirme Kodu
Osm Promosyon Kodu
Titan War Hediye Kodu
Online Oyunlar
Call of Dragons Hediye Kodu
Azar Elmas Kodu
101 Okey Yalla Hediye Kodu
101 Okey Yalla Hediye Kodu
B8DB93A50D
ReplyDeleteen ucuz takipçi
youtube beğeni satın al
tiktok takipçi
bayan takipçi
telafili takipçi