Sunday, January 29, 2012
Tuesday, January 24, 2012
Monitoring Remote JVMs Using JVisualVM
Real-time monitoring of a SOA/ADF
11g server Sun JVM can be provided by several tools. Many of you must have used
or heard about Java VisualVM tool. VisualVM is a tool that provides
a visual interface for viewing detailed information about Java applications
while they are running on a Sun Java Virtual Machine (for JRockit we would use
JRockit Mission Control). VisualVM has features of use to application
developers, system administrators, quality engineers and application users.
Below are some of its key functions and features.
§ Display local and remote Java applications.
§ Display application configuration and runtime
environment.(You can see the JVM startup parameters and properties)
§ Monitor application memory consumption and
runtime behavior(Heap/Non Heap usage and GC Info)
§ Monitor application threads.(Displays number of threads
in JVM, their status ie Running, Sleeping, Inactive, Deadlock)
§ Profile application performance or analyze
memory allocation (Used to troubleshoot Memory Leak and OOM Issues)
§ Take and display thread dumps (Can be used to
troubleshoot performance issues)
§ Take and browse heap dumps.(Used for
troubleshooting Memory Leaks)
§ Analyze core dumps and applications offline.
This tool is available in the HotSpot JDK
installation $HotSpot_JDK_INSTALL/bin. It is started by running the jvisualvm
executable. JVisualVM can be run either on the same machine on which the SOA/ADF
server runs or on a separate machine from the SOA runtime server.
Monitoring Local JVMs using
JVisualVM:
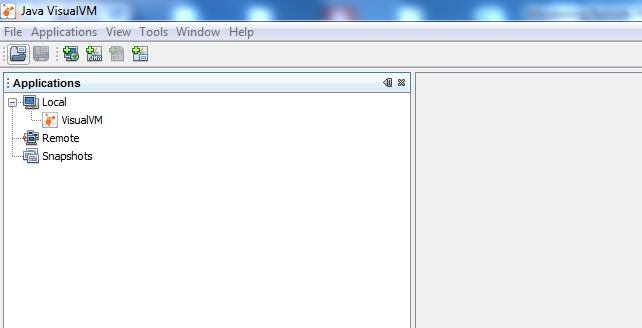
If you are running JVisualVM on the same machine,
on which SOA/ADF JVM runs, the setup is quite simple and straight forward. You
simply have to go to the $JAVA_HOME/bin and run the jvisualvm executable. As
shown below under the Local icon you can find the local JVM process PIDs and
the needed information. Double click on any one of the processes under Local icon and on the right hand
side of the screen you would be able to see the desired information (described
later)

Monitoring Remote JVMs using JVisualVM:
If
running JVisualVM from a remote machine, i.e. a JDK that is remote to the SOA
Managed Server you will need to configure a JMX port in the JVM startup
parameters in order to monitor the SOA/ADF server JVM. Below are the
steps:
1. Configure a JMX port.
1. Configure a JMX port.
Add
the below -Dcom.sun.management.jmxremote
parameters to the SOA/ADF Managed Server JVM startup parameters.Keep in
mind that you only want to define this for a specific server in the domain
since reuse of the JMX port number between servers will not be allowed. For
example if you want to monitor the JVM on soa_server1 you could add the
following to its JVM startup parameters:
-Dcom.sun.management.jmxremote
-Dcom.sun.management.jmxremote.port=8500
-Dcom.sun.management.jmxremote.authenticate=false
-Dcom.sun.management.jmxremote.ssl=false -Djavax.management.builder.initial=weblogic.management.jmx.mbeanserver.WLSMBeanServerBuilder
So after adding the above parameters the JVM
startup parameters would look like:
-server -d64 -Xss256k -Xms1g
-Xmx1g-XX:NewRatio=2 -XX:+AggressiveOpts -XX:PermSize=512m -XX:MaxPermSize=512m
-XX:+UseParallelGC -XX:+UseParallelOldGC -XX:ParallelGCThreads=16
-XX:InitialSurvivorRatio=10 -XX:SurvivorRatio=10 -Dweblogic.management.discover=false
-Dweblogic.StuckThreadMaxTime=900 -XX:+HeapDumpOnOutOfMemoryError
-XX:HeapDumpPath=/tmp/soa_server1_gc.hprof -verbose:gc
-Xloggc:/tmp/soa_server1_gc.log -Dcom.sun.management.jmxremote
-Dcom.sun.management.jmxremote.port=8500 -Dcom.sun.management.jmxremote.authenticate=false
-Dcom.sun.management.jmxremote.ssl=false
-Djavax.management.builder.initial=weblogic.management.jmx.mbeanserver.WLSMBeanServerBuilder
- On How to tune JVM for SOA 11g refer to my post JVM Tuning for SOA 11g
- On how to change JVM startup parameters for SOA 11g refer to my post Change SOA 11g Startup parameters
2. Restart the SOA/ADF Managed Server (The
JVM parameters of which were modified in Step 1)
3. Download and install JVisualVM from here on your local
machine.
4. Open the Command Prompt on your Local Machine and
navigate to the JAVA_HOME/bin as shown below. Enter the command as shown. You can also pass JVM parameters after a -J, for example to set
the maximum PermSize to 256MB:

The JVisualVM Console:
5. Install All of the Available Plug-ins Select
Tools -> Plugins download and install all of the available plugins, this
will give additional display tabs once connected to a JVM. Restart JVisualVM,
going back into Tools -> Plugins -> Installed Tab should show all of the
installed plug-in:

6. Create a Remote Connection if Running
JVisualVM Remotely from the SOA Server
Select
the Add Remote Host icon:

7. Enter the Hostname of the server on which the SOA/ADF
managed server is running. Display name can be anything related to the physical
server. I chose it to be TEST_ADF_Server)

8. Right click on Test_ADF_Server under
Remote icon and click on Add JMX Connection.

9. After the : in the Connection field enter the
defined JMX port of 8500, this is from Dcom.sun.management.jmxremote.port=8500
also check the Display name box(Can be the JVM name):Click OK

10. After few seconds you
should find the Display name(You specified in the previous step under the
TEST_ADF_Server icon.

11. Right Click and click on Open. On the
right hand side page you should find the JVM details as shown below.

Hurray !! You are now connected to the remote JVM via your
local JVisualVM.
You can explore all of the tabs provided,
these seem to be the most useful:Some of them are mentioned below:
1. The Monitor tab:
Provides the following
graphs of the running system:

Also there is a Perform GC button to force a
garbage collection and a Heap Dump button to cause a heap dump. The resulting
heap dump will be eventually loaded into JVisualVM in a new tab where it can be
analyzed. The loading may be slow and perhaps not as detailed as one would
like. It may be a better idea to take heap dumps from the command line from the
JDK installation where the SOA server is running:
The Threads tab:

The VisualGC Tab:
It might report you the below issue(Not Supported for the JVM)

This issue occurs when
there is a version mismatch between You will get
this if the JDK running JVisualVM and the SOA server are not the same version
or if the operating systems do not matchMake sure you use the same version of
JDKs.
This tab provides a visual representation of
the memory Spaces being used in real-time in the PermGen, Old Gen, Eden Space,
and Survivor Spaces (S0 & S1). This gives an idea of how how full each
partition is at any given time. You can use this to scale the defined memory for
the spaces based on actual load.The Graphs section
also provides information on the maximum and current sizes of the spaces and
their garbage collection statistics.
Conclusion
So in the post I basically have shown how would you use JVisualVM to connect to remote as well as local SOA ADF JVMs. Hope this post was helpful. I havent covered the basics and functions of jvisual vm in detail as there are too many posts already. You can find Oracle documentation here
When it comes to SOA Heap dumps, the heap dumps generated might grow very large.The Heap Dump analysing part in jvisualvm might not work well on large jvms(greater than 3 GB). For such JVM heap analysis I would suggest you take manual dumps using jmat and analyse the dump using eclipse memory analyser. I am currently trying this in my lab and will post my updates soon.
When it comes to SOA Heap dumps, the heap dumps generated might grow very large.The Heap Dump analysing part in jvisualvm might not work well on large jvms(greater than 3 GB). For such JVM heap analysis I would suggest you take manual dumps using jmat and analyse the dump using eclipse memory analyser. I am currently trying this in my lab and will post my updates soon.
References
- jvisualvm - Java Virtual Machine Monitoring, Troubleshooting, and Profiling Tool http://docs.oracle.com/javase/6/docs/technotes/tools/share/jvisualvm.html
- VisualVM - http://en.wikipedia.org/wiki/VisualVM
- VisualVM Home page - http://visualvm.java.net/
How did you like this post. Let me know if it helped.
Now you can folow us on facebook and post your comments/views and questions for expert advise. Check this out facebook
Find us on facebook here
Sunday, January 22, 2012
Enterprise Manager Performs Poorly Or Appears To Hang While Displaying the List of SOA Composites on Composite Dashboard Pages
Symptoms
You have an installation of Oracle Fusion Middleware 11g where you have been running a large volume of BPEL processes over time. When accessing the dashboard page displayed by Enterprise Manager for one or more composites, the regions that display list views of composite's instances take a long time to render and during this time Enterprise Manager remains hung and unresponsive for other tasks.At the time when the performance of Enterprise Manager is impacted, you will likely have one or more composites that have a reasonably large number of composite instances defined (over 100,000) and the performance impact may be most noticeable the first time a dashboard page is accessed following a restart of the AdminServer. In severe cases you may be experiencing very long delays (potentially hours) when using Enterprise Manager to accessing the dashboard pages of these composites.Cause(As per metalink note [ID 1351032.1])
At the database layer the SQL query that Enterprise Manager executes to obtain the data displayed on the dashboard is taking far longer than expected to execute, as a result of a less than optimal execution plan having been determined by the Cost Based Optimizer component of the database. The execution plan identified by the Cost Based Optimizer is, in turn, driven by information about the various tables and column indexes that is maintained by database statistics. To reduce processing overhead while creating statistics, the statistics for large tables (over 100,000 rows) are not collected from all rows of the table but using a sampling technique on a smaller subset (by default, 20%).As a result of this sampling based approach, over time the statistics gathered against the sample may not be representative for the larger data set as a whole. When such a discrepancy occurs the unrepresentative statistics can lead the Cost Based Optimizer to identify a bad execution plan that is less efficient on data access and takes significantly longer to complete. In such cases, this causes the source of the long running SQL which so significantly impacts the performance of the list views on Enterprise Manager dashboard pages.
My Solution(Worked fine for me)
1. Login to the SOA 11g EM Console
2. Right Click on SOA-INFRA and go to SOA ADMINISTRATION->COMMON PROPERTIES
3. Enable the Disable fetching of instance and fault count metrics as shown below.
4. Set the Duration Details to 24 or 48 hours as shown below.

5. Now log back to EM console and voila, the EM performance has a sea change. its faster
Explanation
These two properties enable you to perform the following:
- Disable the fetching of instance and fault count data to improve loading times for the following pages:
- Dashboard pages of the SOA Infrastructure, SOA composite applications, service engines, and service components
- Delete with Options: Instances dialog
These settings disable the loading of all metrics information upon page load. For example, on the Dashboard page for the SOA Infrastructure, the values that typically appear in the Running and Total fields in the Recent Composite Instances section and the Instances column of the Deployed Composites section are replaced with links. When these values are large, it can take time to load this page and other pages with similar information. - Specify a default time period that is used as part of the search criteria for retrieving recent instances and faults for display on the following pages:
- Dashboard pages and Instances pages of the SOA Infrastructure, SOA composite applications, service engines, and service components
- Dashboard pages of services and references
- Faults and Rejected Messages pages of the SOA Infrastructure, SOA composite applications, services, and references
- Faults pages of service engines and service components
Now you can folow us on facebook and post your comments/views and questions for expert advise. Check this out facebook
Find us on facebook here
Scheduling BPEL Processes Using Quartz In SOA Suite 11g is not supported by Oracle !
I came across some blogs on that show how to Schedule BPEL Processes Using Quartz In SOA Suite 11g. As a admin I was never comfortable deploying the quartz scheduler application on the Admin server. Did some research on metalink and found the below note:
How Do You Schedule BPEL Processes Using Quartz In SOA Suite 11g [ID 942494.1]
Goal
Solution
Let me know if you have Updates/Views...
Now you can folow us on facebook and post your comments/views and questions for expert advise. Check this out facebook
Find us on facebook here
How Do You Schedule BPEL Processes Using Quartz In SOA Suite 11g [ID 942494.1]
Goal
How do you schedule BPEL
processes through Quartz in SOA Suite 11g.
Solution
What you are attempting is not
available via the standard functionality in the product.The application does not allow users to schedule BPEL processes through Quartz.Enhancement Request (ER) Bug
8927175 has been filed with
Oracle Development. This ER will be reviewed and considered by Development for
a future release. It will remain open until it is eitherincorporated into the product, or it is deemed not feasible.
So my view would be to check with Oracle how to proceed with this!!!
Let me know if you have Updates/Views...
Now you can folow us on facebook and post your comments/views and questions for expert advise. Check this out facebook
Find us on facebook here
Thursday, January 19, 2012
Fusion Middleware 11g Admin Interview Questions Part 1
Lately I have been asked to publish some FMW 11g Administration questions for interviews. Based on my interview experiences I am jotting down some. I would expect you all to add some more questions and answers to the comment section: Also let me know if that helps.
1. Define SOA and how do you explain it to a layman.
2. Deferentiate SOA from Oracle SOA Suite.
3. Define relation between Oracle SOA Suite and Weblogic.
4. Functional differences between Fusion EM console and WLS Admin console.
5. List some key Fusion Middleware 11g products and their usage in brief.
6. Key difference between Oracle SOA Suite 10g and 11g.
7. Define key components/building blocks/basic architecture of Oracle SOA Suite.
8. Explain concept of domains,admin,managed server in Weblogic.
9. Explain basic functionality of Application Servers eg WLS,OAS,Websphere.
10.Difference between Weblogic Development and Production mode.
11. Explain Node Manager in Weblogic.
12. Key functionality of Nodemanager.
13. What are the different types of nodemanager.
14. What is the default port number of nodemanager.
15. Mention the path for Nodemanager home.
16. Explain some properties present in nodemanager.properties file.
17. Is Nodemanager setup mandatory in a standalaone WLS installation.
18. Is nodemanager setup mandatory in a clustered WLS environment. If not what are the demerits.
19. Explain the functionalities of Nodemanager in a clustered WLS environment.
20. Explain the term managed Server Independence mode.
21. Can I start a managed server even if Admin server is down.
22. Can I make configurational changes to managed server if admin server is down.
23. Explain significance of admin server in a WLS domain.
24. Why do you think Oracle recommends not to deploy applications to Admin server in production environments.
25. Explain different ways of starting or stopping WLS Admin/managed server.
26. What is config.xml. Where can I find it.
27. You deployed a faulty code to Admin server which brought it down. You are not able to restart it.How would you undeploy the faulty piece of code then?
28. How do I clear cache for a WLS managed/Admin server.
29. What is meant by datasource.
30. Explain how would you tune a datasource and apply some best practices to it.
31. Explain difference between multicast and unicast IP.
32. Explain hardware requirement for a WLS 2 node cluster.
33. How do you configure OHS/Apache web server for a 2 node WLS cluster?
34. Explain basic steps for SSL configuration in WLS.
35. Explain JVM concept and detailed architecture.
36. What is the function of Permanent Generation (PermGen) space.
37. Explain OOM errors and what are the different causes.
38. Explain Memory Leaks. Explain how would you detect it. state examples of some tools to analyze it.
39. What would be your approach if you are asked to tune JVM.
40. Explain some key Sun JVM startup/tuning arguments.
41. State some JVM tuning properties that you would use in a multi threaded box like the Oracle T series so as to improve JVM performance.
42. Explain Garbage Collection. State some GC algorithms you are aware of.
43. What is the Verbose GC option used for?
44. Explain what would you do to mimimise frequent major GC.
45. Explain difference between major and minor GC.
Let me know if above questions are helpful, I am currently working on some more questions...
Now you can folow us on facebook and post your comments/views and questions for expert advise. Check this out facebook
Find us on facebook here
How to change startup parameter for Admin and Soa managed Server in SOA 11g Suite?
After having read my JVM tuning for SOA 11g post here you must be thinking where do I specify these startup parameters.
Well there are many ways. For e.g. you can mention it in certain files or in the WLS Admin console itself. Mentioning it in the Admin console would need you to use nodemanager for startup of Admin/Managed servers. An easier way is mentioned below. Hope this helps...
For specifying the startup parameters you can use the setSOADomainEnv.sh.You can find this file in $DOMAIN_Folder/bin path. In this file you can find the following:
if [ "${SERVER_NAME}" = "AdminServer" ] ; then
#DEFAULT_MEM_ARGS="-Xms768m -Xmx1600m"
#PORT_MEM_ARGS="-Xms768m -Xmx1600m"
DEFAULT_MEM_ARGS="-Xms1536m -Xmx1536m -Xss512k -XX:PermSize=512m -XX:MaxPermSize=512m -Duser.timezone=GMT -XX:NewRatio=2 -XX:+AggressiveOpts -XX:+UseParallelGC -XX:+UseParallelOldGC -XX:ParallelGCThreads=32 -XX:InitialSurvivorRatio=10 -XX:SurvivorRatio=10 -Dweblogic.StuckThreadMaxTime=900"
PORT_MEM_ARGS="-Xms1536m -Xmx1536m -Xss512k -XX:PermSize=512m -XX:MaxPermSize=512m -Duser.timezone=GMT -XX:NewRatio=2 -XX:+AggressiveOpts -XX:+UseParallelGC -XX:+UseParallelOldGC -XX:ParallelGCThreads=32 -XX:InitialSurvivorRatio=10 -XX:SurvivorRatio=10 -Dweblogic.StuckThreadMaxTime=900"
fi
#if [ "${SERVER_NAME}" = "soa_ms_1" ] ; then
#DEFAULT_MEM_ARGS="-Xms2048m -Xmx3000m"
#PORT_MEM_ARGS="-Xms2048m -Xmx3000m"
#DEFAULT_MEM_ARGS="-Xss512k -Xms4g -Xmx4g -XX:PermSize=768m -XX:MaxPermSize=768m"
#PORT_MEM_ARGS="-Xss512k -Xms4g -Xmx4g -XX:PermSize=768m -XX:MaxPermSize=768m"
#fi
Make changes as needed by you for the Admin or Manged server. Restart the server. Check the out file and verify if changes took place.
Now you can folow us on facebook and post your comments/views and questions for expert advise. Check this out facebook
Find us on facebook here
Subscribe to:
Comments (Atom)